Avatittinnik Kamatsiarniq and Climate Change

À propos
“Most Inuit elders alive today were born on the land and their values and their knowledge were shaped by largely predictable changes in the environment…now the weather is difficult to predict even for the most experienced hunters, ice conditions are rapidly changing and increasingly unpredictable, and wildlife movements and distributions differ from known variations [creating] ripple effects on our livelihoods, local economies and the learning and development of our youth.” - ITK Climate Change Strategy, 2019
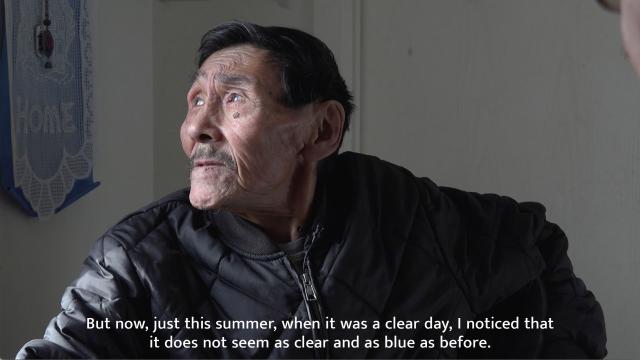
In Avatittinnik Kamatsiarniq and Climate Change, Zacharias Kunuk explored the Inuit value of Avatittinnik Kamatsiarniq – environmental stewardship – and the impact of climate change on people and environment in the Igloolik-Amittuq region. Research was compiled from various sources on various groups and data collected. Zach created a film talking with elders, hunters, and HTO members, about issues of environmental stewardship. Zach and elders set out with several boats, accompanied by a film crew, to explore the region for the effects of climate change on land, animals, water, and marine mammals. While hunting traditions are strong in the Igloolik area, known for its great diversity of wildlife, particularly marine mammals, there are many issues putting these traditions at risk for future generations: traveling safely on the land and sea with ice changes, migration patterns of animals with both scarcity and conservation, food security, and mining, with Baffinland the largest, an iron mine close to Igloolik.
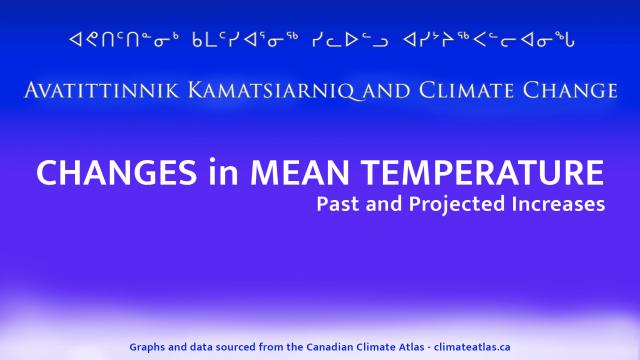
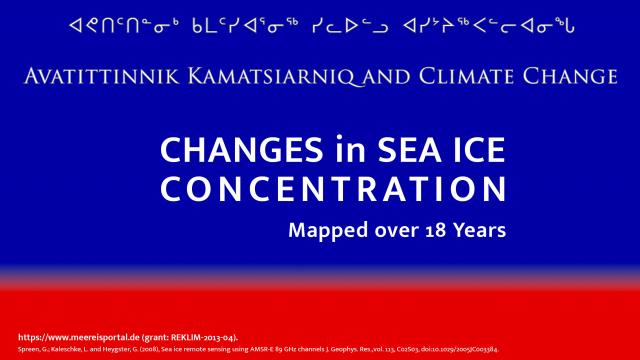
Avatittinnik Kamatsiarniq and Climate Change pairs studies in climate change with the words of Inuit elders. Elder’s words are supported with mapped records and data documenting past and projected environmental changes in stark terms. There are various data sources, such as space agencies and weather bureaus that provide info and animated general maps. The best studies and maps we found came from the University of Bremen and the meereisportal. Featured are edited versions showing the inhabited Arctic region within Canada, with years and months selected for clarity and contrast. For those interested, larger maps encompassing the entire top of the globe for every month since 2003 are available. Graphs showing temperature trends are sourced from the excellent Canadian Climate Atlas as well as Environment Canada. Permission to include graphs and maps on the website were granted by both centres.
Tagged:
climate changeMedia on this Channel
RSS Feed:
×


